No puede seleccionar más de 25 temas
Los temas deben comenzar con una letra o número, pueden incluir guiones ('-') y pueden tener hasta 35 caracteres de largo.
|
|
hace 1 año | |
|---|---|---|
| grafana | hace 1 año | |
| static | hace 4 años | |
| .gitignore | hace 4 años | |
| LICENSE | hace 4 años | |
| README.md | hace 4 años | |
| db.py | hace 1 año | |
| docker-compose.yaml | hace 1 año | |
| env-example | hace 1 año | |
| requirements.txt | hace 4 años | |
| trade.py | hace 1 año | |
| tradeogre.py | hace 1 año | |
README.md
totrader
Experimental market maker script for TradeOgre. As of now it checks if the bid-ask spread is over a certain threshold and places a buy and sell order above and below the current bid and ask.
This is still a work in progress.
Setup
# Setup secrets and adjust parameters
cp env-example .env
vim .env

# Run containers
docker-compose up -d
Usage
This is a command line tool with an option to run continuously or only once.
$ ./trade.py --help
usage: trade.py [-h] [--market-maker] [--balances] [--update-orders]
                [--market-data] [--run]

Helpful TradeOgre trading script

optional arguments:
  -h, --help       show this help message and exit
  --market-maker   Put in buy/sell orders
  --balances       Update coin balances of both base and currency
  --update-orders  Update status of orders
  --market-data    Update market data
  --run            Run continuously
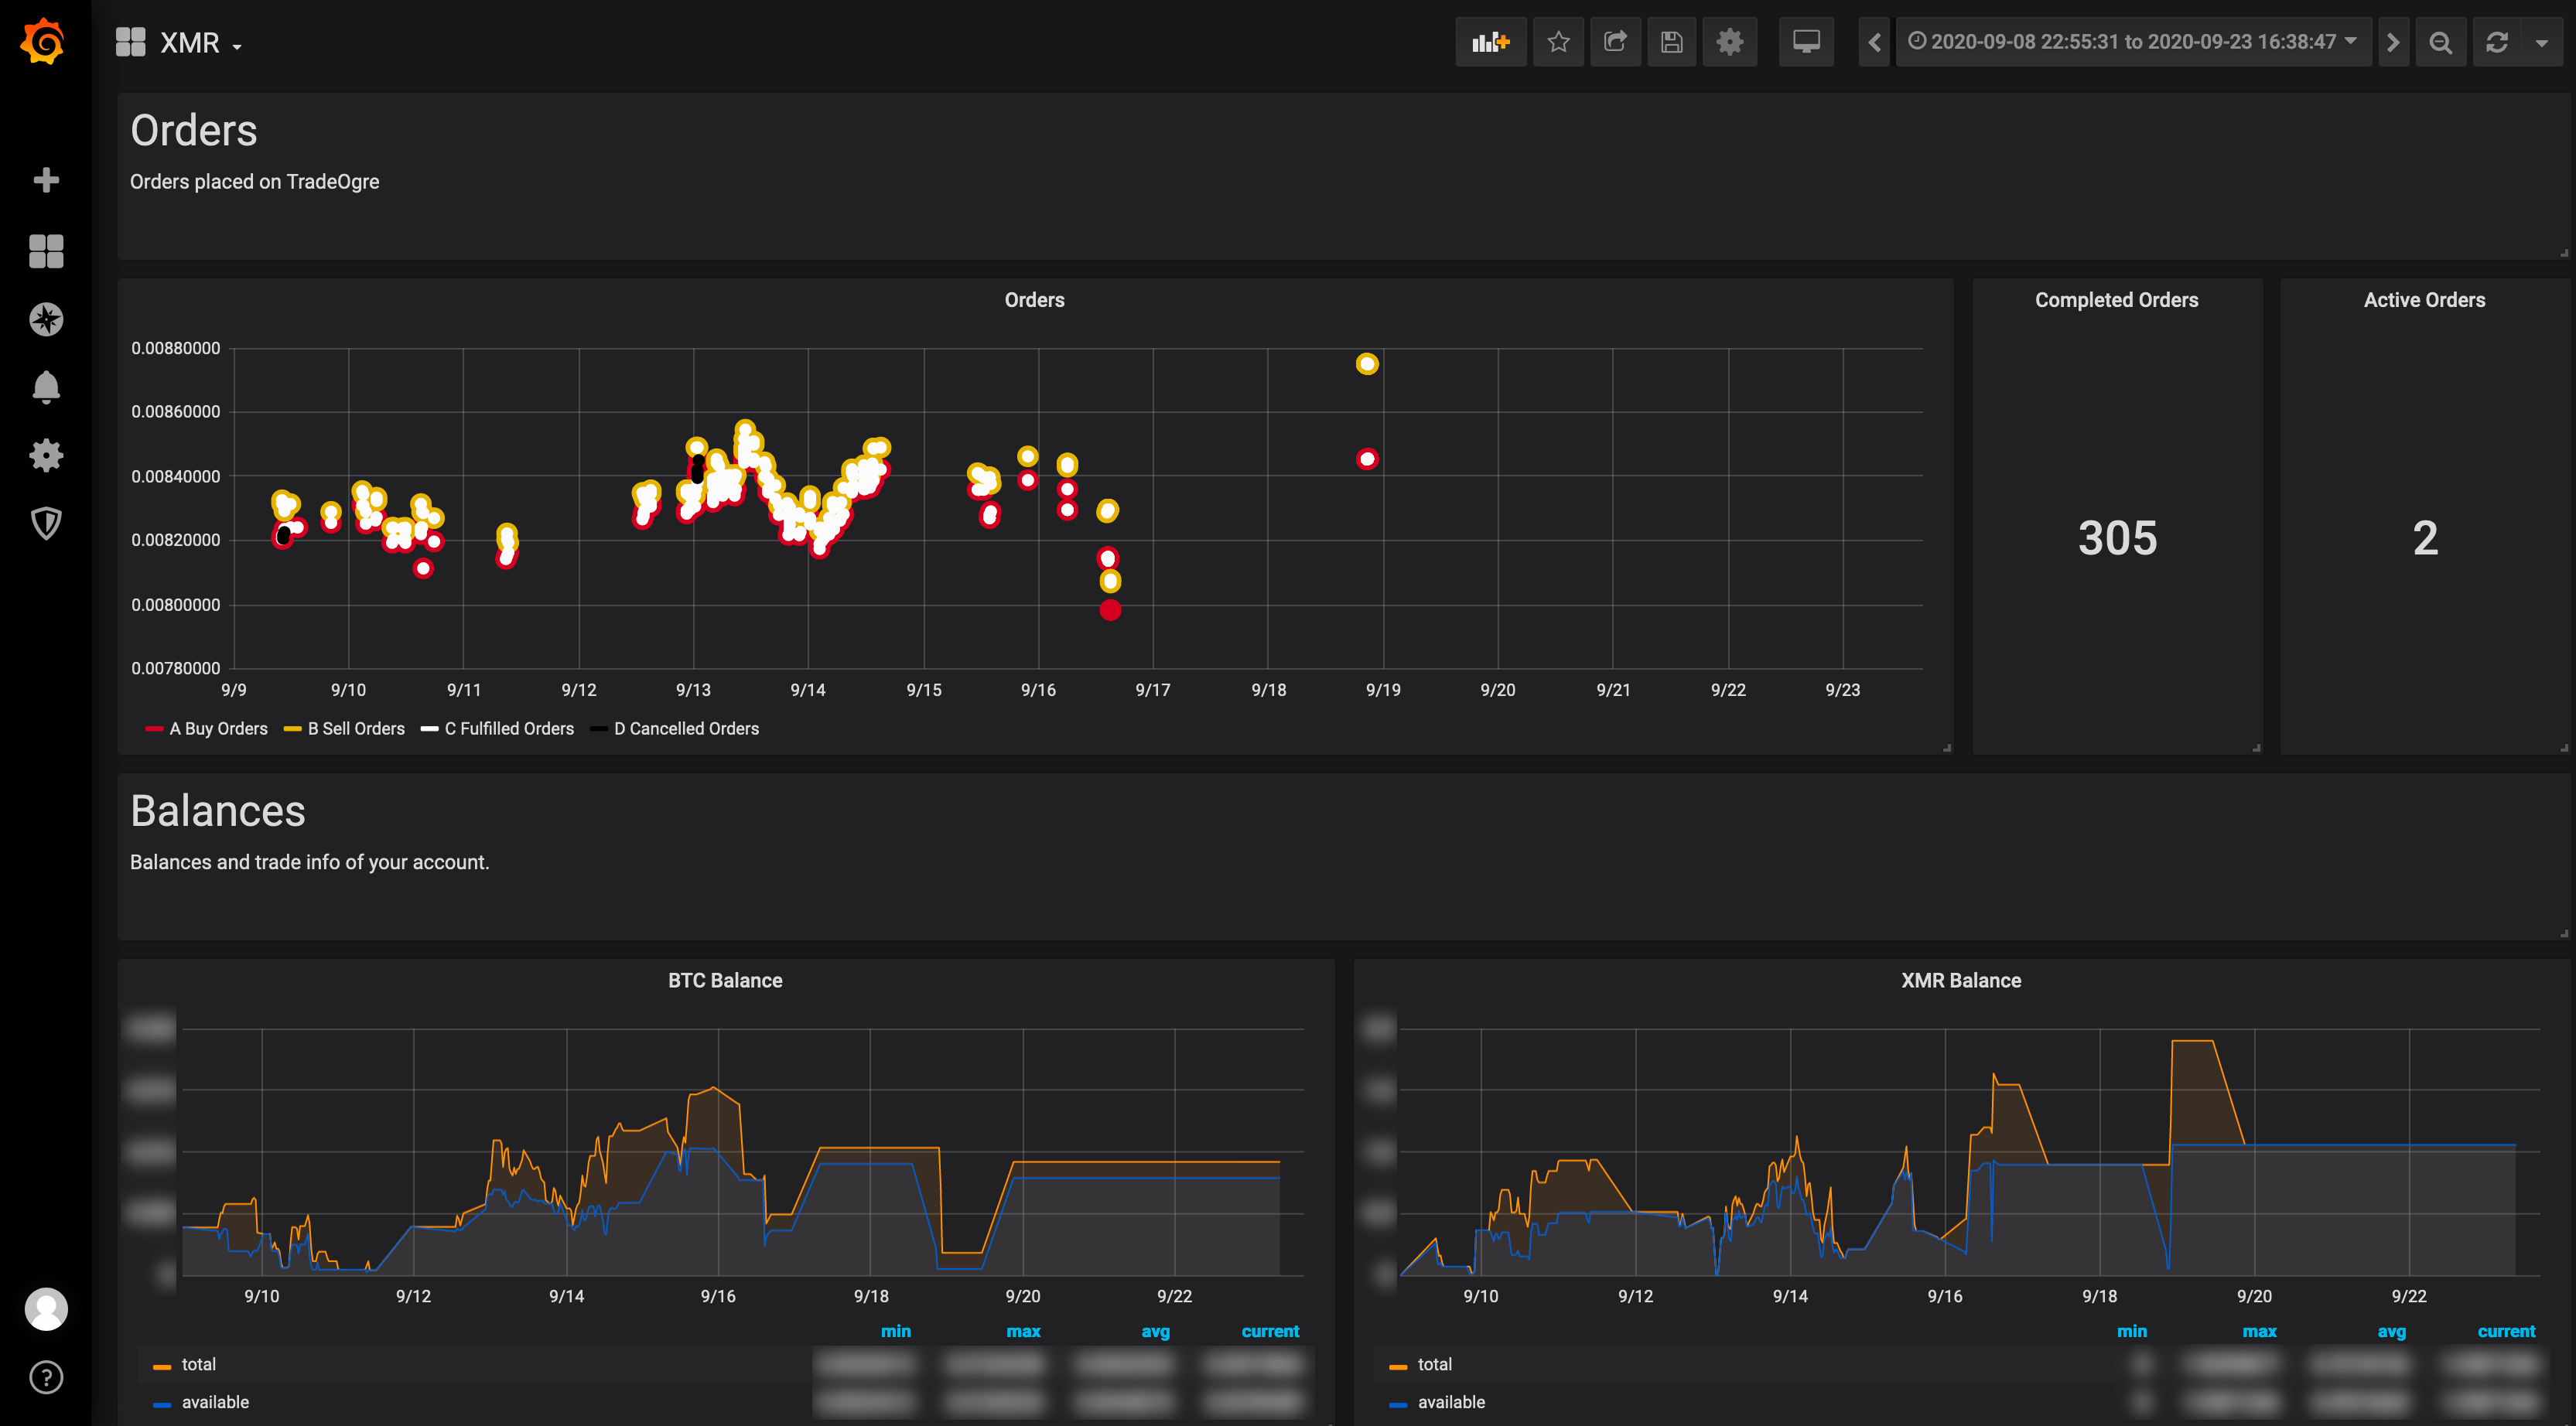
View the results/metrics in your browser at http://localhost:3000 with the Grafana password specified. You'll need to add a datasource for the PostgreSQL database. Dial that in and your graphs should start working. Here's what it looks like: